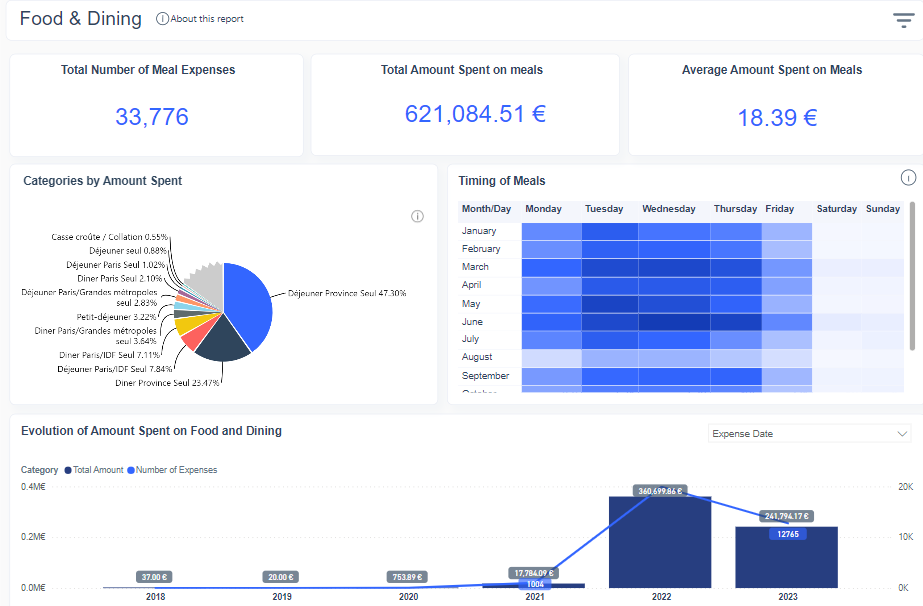
The food and dining dashboard shows the meals categories, the number of people per meal, the days and months when employees eat out more and less often and the dynamics of these expenses.
We can see:
- An overview of the number, total and average amount spent on food.
- The food subcategories using the clients wording
- The evolution of food expenses in both number and value
- The number of people per meal
- The days and months when the employees eat out the most.
This tool provides precise insights into employees' dining habits, which are crucial for enforcing expense policies and preventing misuse. No other alternative can match its depth of analysis.
With this data in hand, the finance team can proactively implement rules to restrict such expenditures and educate the staff about reasonable spending habits. This proactive approach ensures both policy adherence and responsible spending practices.
Was this article helpful?
That’s Great!
Thank you for your feedback
Sorry! We couldn't be helpful
Thank you for your feedback
Feedback sent
We appreciate your effort and will try to fix the article